
Multiverse analysis: Exploring the entire universe of analyses
You have your data, you did your analysis, you have some results – and yet you’re not sure: could the results have been different? What if you choose a slightly different analytical technique? What if you added a covariate, limited the sample, or measured a variable differently? Maybe you’re so curious that you change any of these factors and rerun your analysis – with a different result. Now what? And what if you changed one of the other factors as well, would one of the two results hold, or would you find yet another result? These considerations are common when analysing data and are oftentimes experienced as frustrating by analysts…it seems a bit like opening Pandora’s Box , going down a particularly nasty rabbit hole with no way out. What to do?
Analysts who reflect on their analytical choices recognise these thoughts and concerns yet oftentimes feel helpless about them because it all seems so daunting…how can you know which of the various analytical paths you could have taken is more robust than any of the other similarly justifiable paths? And what if the outcome of your analysis is contingent on potentially “just one” of the many analytical choices you make? Maybe for example, it doesn’t matter which statistical analysis you choose once you decide to operationalise a variable in one way, but not in another way. How could you know?
Clearly there are many different ways to answer the same question – we explore and document this in great detail in our OBHDP paper (Schweinsberg et al., 2021), a crowdsourced project in which independent analysts used the same dataset to test two hypotheses regarding the effects of scientists’ gender and professional status on verbosity during group meetings. We use multiverse analysis to track the different ways in which analysts conducted their analysis and then run all possible analytical combinations that arise as a result. We paid so the paper is available in open access format – you can read it for free here.
Schweinsberg et al. (2021): Same data, different conclusions.
A multiverse analysis identifies the extent to which results are contingent on analytical choices. Multiverse analysis identifies how analytical choices create variance in results (Steegen, Tuerlinckx, Gelman, & Vanpaemel, 2016 ; Liu, Kale, Althoff, & Heer, 2020). In a multiverse analysis, you first identify the analytical choices inherent in an analysis. Usually these choices are taken for granted “because that’s what works”, or “that’s how I always exclude outliers”, or because “that’s the statistical technique I learnt in grad school”. In a multiverse analysis you make these kinds of implicit analytical choices explicit so you can test to what extent each of these choices contribute to finding a certain result.
Imagine you have fantastic data on rockclimbing performance at a particular rockclimbing site and you have a very simple question: is “group A” or “group B” better at rockclimbing a this site? You have to make various analytical choices:
- How do you measure the dependent variable “performance”? How do you operationalize “better at rockclimbing”? Maybe you measure time it takes to get to the top, or the number of times a group falls down, or some other measure?
- How do you relate the independent variable (membership in group A / group B) to the dependent variable (rockclimbing performance)? You could use a particular regression analysis, t-tests, some other frequentist analysis, or perform a Bayesian analysis?
- Should you include covariates to control for unrelated factors? Maybe you know that groups A and B work very different jobs and so Group A mostly goes rockclimbing early in the morning (when you can see the rock perfectly), but group B’s working hours force them go late at night (when you can’t see the rock well). You might then want to control for this.
- How do you deal with outliers or with missing data? Assume you operationalise performance as “time it takes to get to the top”, how do you deal with extreme data points in your sample? What if someone’s data shows it supposedly took them weeks or months to climb to the top?
A universe of analyses
In a multiverse analysis you take each possible analytical option and cross it with all other possible analytical options, resulting in a universe of possible analyses.
Imagine a simple analysis:
- 2 analysts
- who decide on “which statistical technique to use”, and
- “how to operationalize the dependent variable”
Let’s say that:
- analyst 1 chooses regression analysis and operationalizes the DV (rockclimbing performance) as “time to get to the top”
- analyst 2 chooses a Bayesian approach and operationalizes the DV (rockclimbing performance) as “number of times climber fell down”
In a multiverse analysis you now run all possible combinations of these choices so you can explore the universe of possible analyses. In this example the universe only consists of 4 different analyses:
- Statistical technique = regression & DV = “time to get to the top” (analyst 1’s original analysis)
- Statistical technique = regression & DV = “number of times climber fell down” (analyst 1’s statistical technique but analyst 2’s choice of DV)
- Statistical technique = Bayesian & DV = “time to get to the top” (analyst 2’s statistical technique but analyst 1’s choice of DV)
- Statistical technique = Bayesian & DV = “number of times climber fell down” (analyst 2’s original analysis)
The universe of possible analyses expands rapidly if we consider additional factors, and / or if the analysts make other analytical choices. Imagine that everything stays the same but that analyst 1 decides to include “time of day” as a covariate.
The universe of possible analyses has now doubled to 8:
- Statistical technique = regression & DV = “time to get to the top” & covariate = time of day
- Statistical technique = regression & DV = “time to get to the top” & covariate = none
- Statistical technique = regression & DV = “number of times fell down” & covariate = time of day
- Statistical technique = regression & DV = “number of times fell down” & covariate = none
- Statistical technique = bayesian & DV = “time to get to the top” & covariate = time of day
- Statistical technique = bayesian & DV = “time to get to the top” & covariate = none
- Statistical technique = bayesian & DV = “number of times fell down” & covariate = time of day
- Statistical technique = bayesian & DV = “number of times fell down” & covariate = none
Real world data is messy and analyst 2 may decide to exclude data when “time to get to the top” is more than 3 standard deviations removed from the mean. We now need to run the following analyses:
- Statistical technique = regression & DV = “time to get to the top” & covariate = time of day & exclude = no exclusions
- Statistical technique = regression & DV = “time to get to the top” & covariate = time of day & exclude = if > 3 S.D. from the mean
- Statistical technique = regression & DV = “time to get to the top” & covariate = none & exclude = no exclusions
- Statistical technique = regression & DV = “time to get to the top” & covariate = none & exclude = if > 3 S.D. from the mean
- Statistical technique = regression & DV = “number of times fell down” & covariate = time of day & exclude = no exclusions
- Statistical technique = regression & DV = “number of times fell down” & covariate = time of day & exclude = if > 3 S.D. from the mean
- Statistical technique = regression & DV = “number of times fell down” & covariate = none & exclude = no exclusions
- Statistical technique = regression & DV = “number of times fell down” & covariate = none & exclude = if > 3 S.D. from the mean
- Statistical technique = bayesian & DV = “time to get to the top” & covariate = time of day & exclude = no exclusions
- Statistical technique = bayesian & DV = “time to get to the top” & covariate = time of day & exclude = if > 3 S.D. from the mean
- Statistical technique = bayesian & DV = “time to get to the top” & covariate = none & exclude = no exclusions
- Statistical technique = bayesian & DV = “time to get to the top” & covariate = none & exclude = if > 3 S.D. from the mean
- Statistical technique = bayesian & DV = “number of times fell down” & covariate = time of day & exclude = no exclusions
- Statistical technique = bayesian & DV = “number of times fell down” & covariate = time of day & exclude = if > 3 S.D. from the mean
- Statistical technique = bayesian & DV = “number of times fell down” & covariate = none & exclude = no exclusions
- Statistical technique = bayesian & DV = “number of times fell down” & covariate = none & exclude = if > 3 S.D. from the mean
UNDERSTANDING THE UNIVERSE OF ANALYSES
Even simple analyses can quickly balloon into a huge number of analyses. A multiverse analysis examines all these different combinations and provides insights into how much results are contingent on any particular analytical choice.
The BOBA approach to multiverse analyses (Liu et al., 2020) reveals analysis-contingent results graphically. In our paper (Schweinsberg et al., 2021) operationalisations of key variables created more variance than statistical choices: once analysts decided how to operationalise key measures it mattered less which kind of statistical technique they ran, or which covariates they included.
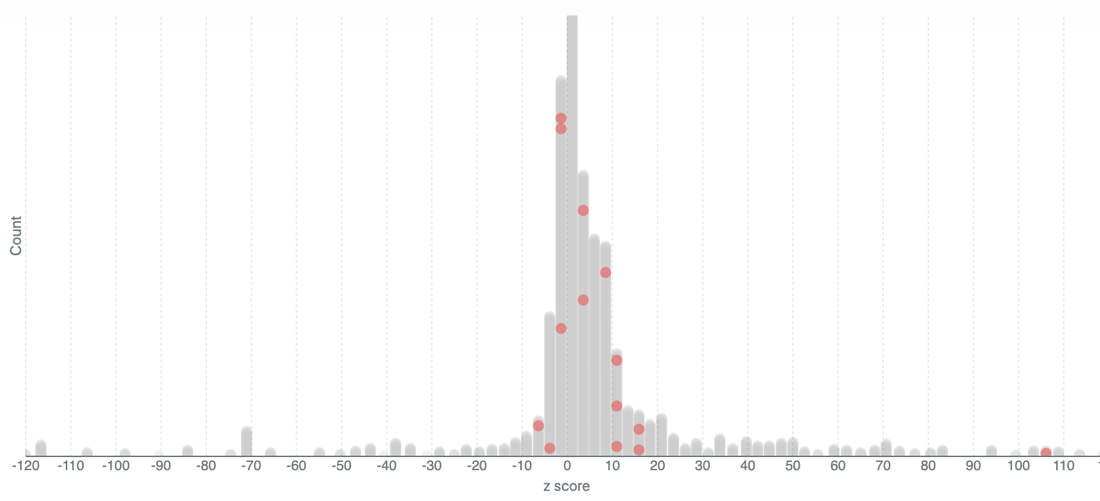
Revealing the full universe of results
The first graph shows the entire universe of possible results revealed in Schweinsberg et al. (2021). This distribution shows all possible results given the analytical choices analysts had. The red dots indicate results actually found by analysts. The universe of possible results is of course much wider than the actual results. A standard empirical paper would only report 1 of these red dots as “the result”, masking the extent to which other results are possible and suppressing which analytical choices led to the result.
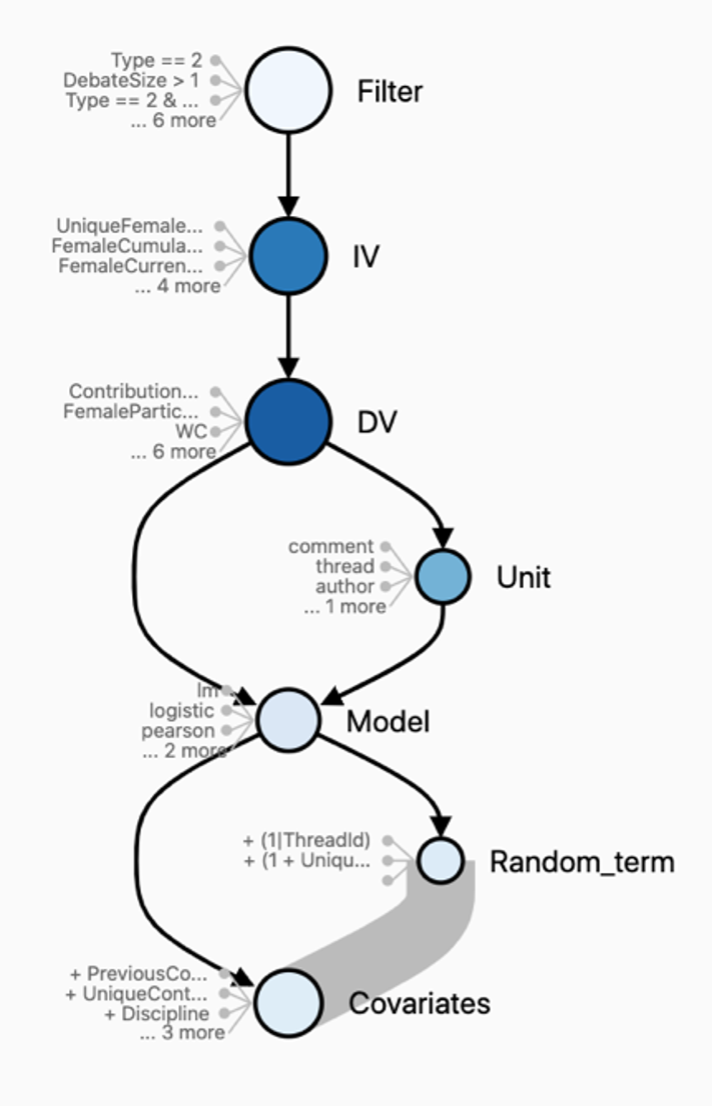
Understanding which analytical choices matter
This second graph provides a detailed assessment of exactly which analytical choices cause variance in the reported results. The darker the node, the bigger its impact on the reported results. Operationalizing the dependent variable and independent variable had the biggest impact on the reported results, whilst the choice of covariates, filters, or random terms mattered relatively less.
Identifying nonsensical cells in multiverse analysis
A key challenge in multiverse analysis is to identify nonsensical combinations **before** running the multiverse. For example, analyst A may choose a logistic regression analysis with a binary outcome (did not climb to the top = 0, climbed to the top = 1) whereas analyst B may choose a linear regression with a continuous outcome (number of seconds to get to the top). It is possible to combine the logistic regression analysis of analyst A with the continuous outcome of analyst B but the output of this analysis may not be sensical. You therefore have to identify nonsensical cells in advance. I will share one way of doing this in the next post.
REFERENCES
Steegen, S., Tuerlinckx, F., Gelman, A., & Vanpaemel, W. (2016). Increasing transparency through a multiverse analysis. Perspectives on Psychological Science, 11(5), 702-712. doi:10.1177/1745691616658637
Liu, Y., Kale, A., Althoff, T., & Heer, J. (2020). Boba: Authoring and visualizing multiverse analyses. IEEE Transactions on Visualization and Computer Graphics, 27(2), 1753-1763. doi:10.1109/TVCG.2020.3028985
Schweinsberg, M., Feldman, M., Staub, N., van den Akker, O. R., van Aert, R. C. M., van Assen, M. A. L. M., … Uhlmann, E. L. (2021). Same data, different conclusions: Radical dispersion in empirical results when independent analysts operationalize and test the same hypothesis. Forthcoming in Organizational Behavior and Human Decision Processes.
Simonsohn, U., Simmons, J. P., & Nelson, L. D. (2020). Specification curve analysis. Nature Human Behaviour. doi:10.1038/s41562-020-0912-z